OVI: The Online Value Index
What is the Online Value Index (OVI)?
The “Online Value Index” (OVI) is XOVI’s key metric for measuring the visibility of your domain in the organic search results (SERPs) of Google and Bing.
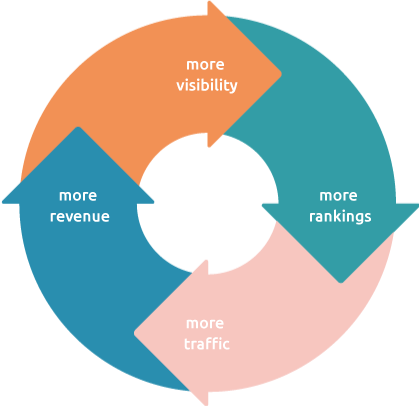
A higher OVI means greater visibility, indicating that your website ranks for more keywords across search engines. This generally translates to increased traffic as more visitors discover your site through organic search. Monitor and improve your OVI to drive consistent growth in your online presence.
What does the OVI tell you?
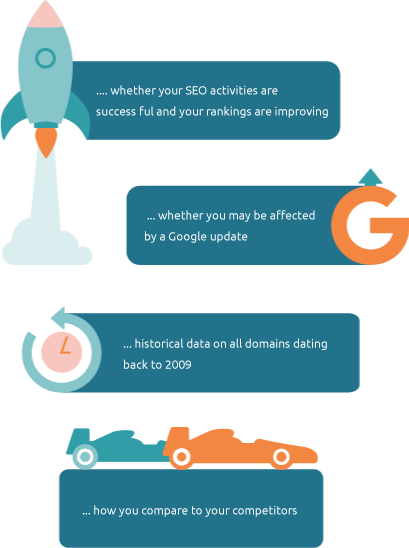
You can see relatively easily from the OVI whether your SEO activities are successful or not. If your OVI increases, the number of your rankings will also increase.
You can see at a glance how you are performing in direct comparison to your competitors. Simply add your competitors when creating a project. You can then see the development of your visibility curve and that of your competitors graphically.
You receive historical data for all domains back to 2009 – free of seasonal fluctuations.
You can also use your Online Value Index to see whether you are affected by a Google update.
How is the OVI calculated?
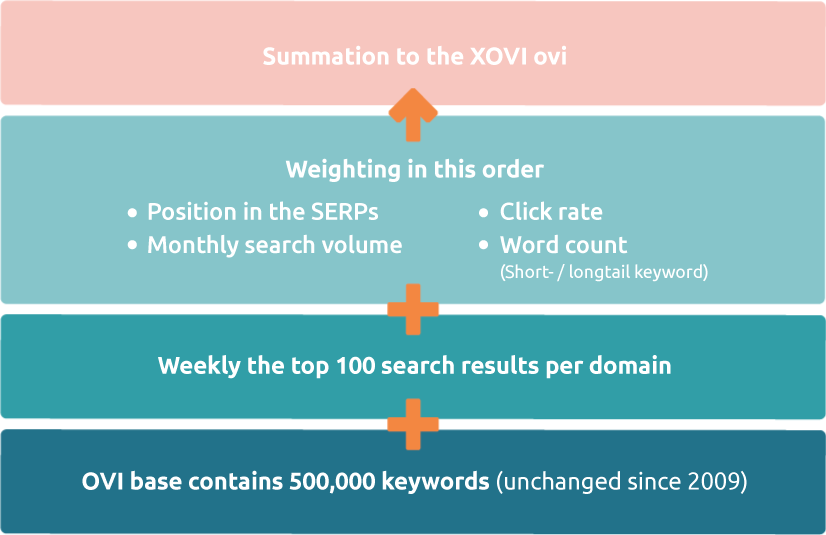
XOVI’s Online Value Index (OVI) is calculated weekly using the top 100 rankings per domain. This is based on a robust database of 500,000 keywords, carefully curated to represent a broad cross-section of industries such as shopping, travel, finance, insurance, education, and health.
The OVI serves as a dependable metric to assess the visibility of your website and that of your competitors.
Importantly, the keyword database used for the calculation of the XOVI Visibility Index remains consistent over time. This means only keywords continuously tracked by our crawlers since the start of data collection for each Google region are included. For instance, Google Germany’s OVI has relied on the same keyword base since 2009, ensuring stable and reliable measurements.
| Search engine | OVI data collection since | Keyword basis |
| google.com (USA) | 13.09.2015 | 500.000 |
| google.co.uk (UK) | 13.09.2015 | 500.000 |
| google.de (Germany) | 17.12.2009 | 500.000 |
| google.at (Austria) | 17.12.2009 | 500.000 |
| google.ch (Switzerland) | 17.12.2009 | 500.000 |
| google.es (Spain) | 13.09.2015 | 500.000 |
| google.fr (France) | 13.09.2015 | 500.000 |
| google.it (Italy) | 13.09.2015 | 500.000 |
| bing.com (Germany) | 20.12.2012 | 500.000 |
Table: Start of OVI data collection by country
Calculation
For the further calculation of the Online Value Index, the rankings achieved are given different weightings depending on their position in the SERPs, the monthly search volume, the click rate and the number of words per keyword. For example, 4th place for a keyword such as “photographer” with a very high search volume and high click rate is weighted more heavily than 1st place for “photographer Buxtehude”.
The higher your OVI, the more visible you are in the Google SERPs, in other words, the more rankings and hopefully visitors your website will get.
How would you categorize your OVI?
The XOVI Visibility Index (OVI) is open-ended. For example, wikipedia.org has a value of 16,248 and transfermarkt.com has 4.19 To help you assess yourself, it’s best to compare yourself to your competitors. What OVI do you have and what OVI do your competitors have?
Make sure that you and your competitors have a similar service/product portfolio. This is the only way to draw the best possible conclusions from the course of your OVI curve in comparison to the competition.
If you compare yourself with real giants like Amazon, for example, since they rank for your product in the top spots in Google search results, your POI may turn out to be negligible in comparison. Amazon has a huge product range and can therefore rank with more keywords from our POI keyword base and thus achieve a much higher visibility index.
| Domain | OVI (2025) |
| reddit.com | |
| amazon.com | |
| youtube.com | |
| ebay.com | 4,223.96 |
| walmart.com | 2,252.97 |
| nytimes.com | |
| target.com | |
| imdb.com | |
| cnn.com | |
| x.com |
Table: OVI of various domains
Your personalized visibility index
To effectively benchmark yourself against competitors, use the Rank Tracker tool to create a custom visibility index based on your key shared keywords. This allows you to track the metrics that matter most to your business and focus on your unique strengths.
The Rank Tracker tool also enables detailed comparisons with competitors, including giants like Amazon. However, the comparison is fine-tuned to focus specifically on your products and targeted keywords, ensuring actionable insights that align with your goals.
XOVI OVI
FAQ
What is the difference between OVI and monitoring OVI?
The Online Value Index is calculated for Google from 500,000 keywords. These keywords represent a cross-section of a wide range of industries and must meet certain criteria. When calculating your OVI, keywords from outside your industry are also included for you. Similarly, not all keywords relevant to you can be included in our OVI database, especially if you are in a niche. The OVI is therefore a very good measure for an initial analysis of your general visibility. You can view historical data on your domain’s visibility dating back to 2009. The OVI shows you whether the SEO measures you have implemented are starting to bear fruit and your rankings and OVI are increasing. The OVI is also useful for determining whether you might be affected by a Google update.
If you want detailed analyses for your keyword set, you should use the Project Visibility tool. This enables you to analyze the ranking development over time of the keywords relevant to you in comparison to your competitors. You create your own keyword set in the Rank Tracker tool and then your individual monitoring OVI is calculated.
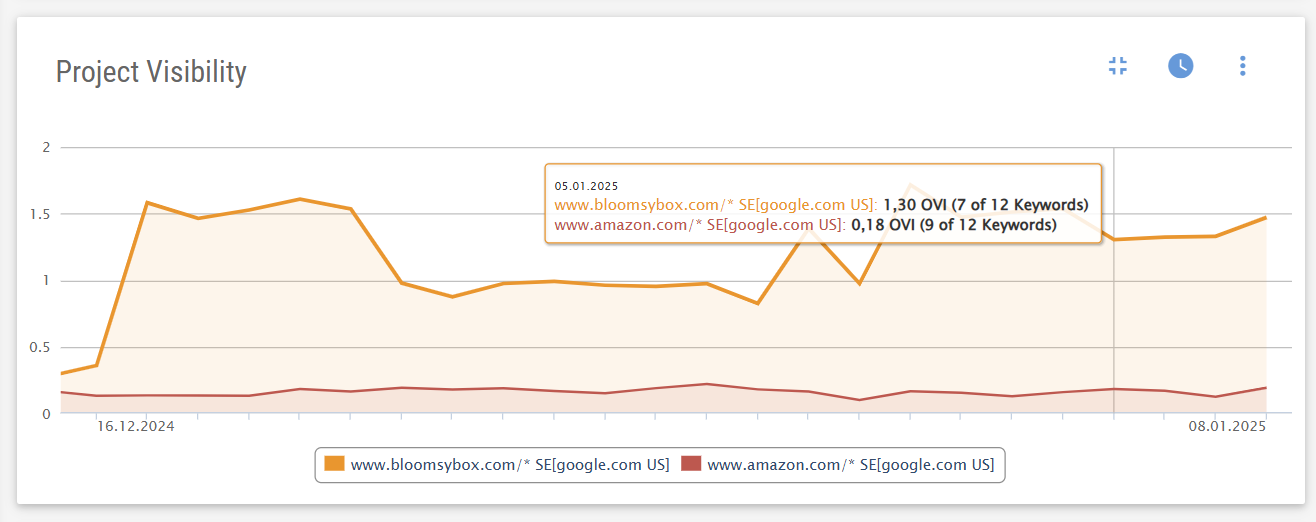
Let’s take a closer look at this using the domains bloomsybox.com and amazon.com.
 |
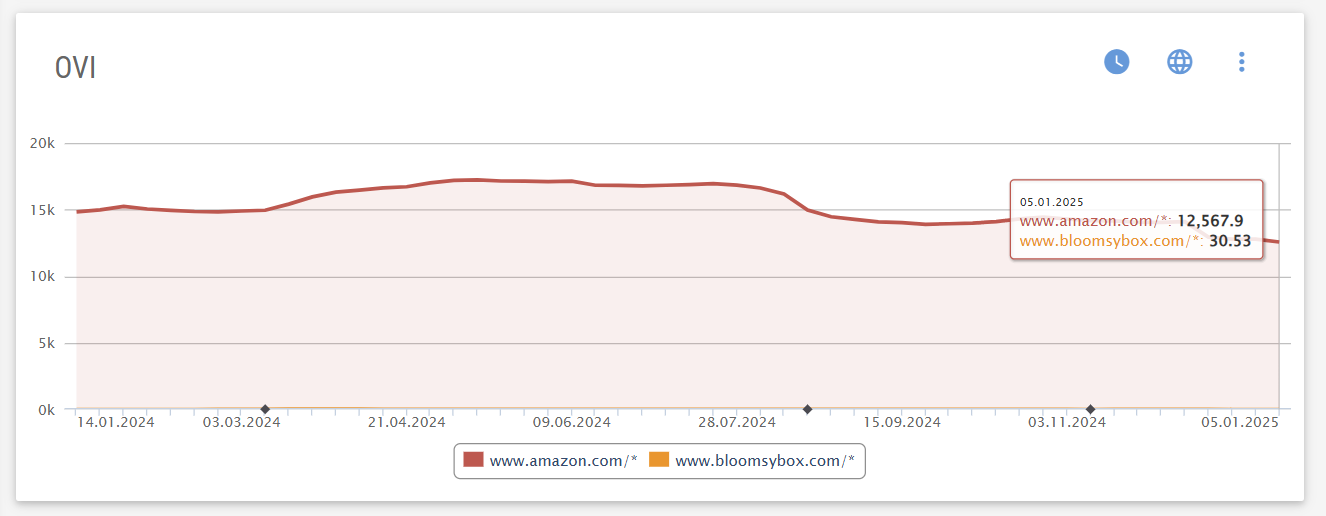 |
The figures show how the visibility curves for the domains bloomsybox.com and amazon.com have developed for the OVI and the monitoring OVI since December and January 2024.
For the “general” OVI, the domain amazon.com achieves a 411.65x higher value than the domain bloomsybox.com due to the huge product portfolio.
If you look at the project visibility, it looks different. Here, the comparison is based exclusively on the keywords that are really relevant for bloomsybox.com. The project visibility of bloomsybox.com is 7.22x higher than that of amazon.com.
You should use the project visibility tool in your reports. Here you can show your SEO success based on your or the customer’s selected keywords in both graphical and tabular form and show exactly how you compare to your competitors.
Is the OVI a traffic index?
The OVI is not a traffic index and is independent of seasonal fluctuations. For example, if you offer Advent calendars in your shop and consistently rank first on Google for them, your traffic will naturally peak in the last quarter as users start searching for Advent calendars. However, your OVI can remain consistent throughout the year.
While your traffic is affected by seasonal factors like weather, vacations, holidays, and weekdays, your OVI remains stable. Despite these variations, a higher OVI generally correlates with increased visitor numbers. The better your visibility in Google SERPs, the more your traffic is likely to grow.
Why is my OVI dropping?
First, observe whether the change is temporary or if your visibility recovers after a short time. Some fluctuations are entirely normal. However, if the downward trend continues and your rankings keep falling, several factors could be responsible. Your competitors may have implemented successful SEO strategies, pushing your site down in the rankings. Google might have updated its algorithm and re-evaluated your website. Changes or deletions in your website’s content could also impact visibility. Similarly, an improperly managed website relaunch, technical issues, or even a Google penalty might be to blame. Additionally, evolving user search behavior, such as an increase in voice search, could play a role.
If several of these factors are affecting your visibility simultaneously, you can narrow down the cause with a few steps. Compare your OVI curve to those of your competitors. If their visibility has increased while yours has dropped, they may have gained more and better rankings, while yours have declined. This can be a preliminary indicator requiring further investigation.
Use the tool to analyze whether specific directories on your website have lost visibility. This can be checked under Keywords > Directories > Overview > Directories. Investigate whether technical or editorial changes have occurred in these directories. In the Keywords > Ranking Changes section, review any keywords that have dropped in rank or disappeared from the top 100. You can filter by “Lost Keywords” or “Demoted Keywords” for a clearer view.
Additionally, check the Search Console for notifications of manual penalties. Speak with your team to confirm whether any changes were made without your knowledge. Stay informed about potential Google algorithm updates via social media and XOVI updates.