



Key Takeaways
- Riva measures AI visibility separately for individual offerings rather than reducing the whole business to one score.
- Each offering is defined by a product or service, target audience, and geographic focus.
- AI Visibility shows how often an offering appears in relevant AI answers.
- Average Position shows how prominently the business appears when it is mentioned.
- Query Success shows how many relevant generated queries return the business.
- Competitor comparisons and the Improvement Center help explain where visibility is weaker and what to improve next.
Riva does not treat AI visibility as one number for the entire business. It analyzes the company first, then evaluates individual offerings separately. Each offering combines a product or service, target audience, and geographic focus. Riva generates realistic user-like queries around those offerings and measures how often the business appears, where it appears, and how it compares with competitors.
1. Start With Company Information
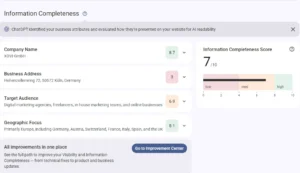
Before Riva measures offering-level visibility, it analyzes four core business attributes:
- Company name
- Business address
- Target audience
- Geographic focus
Riva checks whether this information is correct, consistent, clear, well structured, missing, or contradictory.
This gives teams a baseline for understanding how core business information is represented before looking at individual products and services.
2. Understand the Client’s Offerings
Riva identifies up to three core offerings based on the business information it analyzes. Each offering combines:
- A product or service
- A target audience
- A geographic focus
This matters because different offerings from the same business can perform very differently in AI-powered discovery.
A company may be highly visible for one service while barely appearing for another. Looking at offerings separately makes those differences visible.
3. Read AI Visibility
AI Visibility shows how often an offering appears in AI-generated answers for the relevant queries Riva runs around that offering.
Riva generates realistic, user-like queries based on the offering rather than requiring the agency to manually build every prompt.
The metric helps answer a simple question:
How often does this offering appear when relevant questions are asked?
A stronger result means the offering appears more frequently across those relevant queries. A weaker result shows that visibility is more limited.
4. Read Average Position
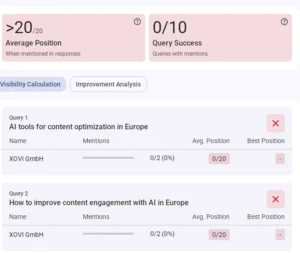
Average Position shows how prominently the business appears when it is mentioned.
Appearing near the beginning of an answer is different from appearing after several competitors. Average Position helps agencies see that distinction.
It should be read alongside AI Visibility rather than on its own. An offering may appear frequently but less prominently, or appear less frequently but in a stronger position when it does surface.
5. Read Query Success
Query Success shows how many relevant generated queries result in the business appearing at all.
Together, Query Success and Average Position reveal two different visibility patterns.
A business can have strong Query Success but weaker Average Position. That means it appears across many relevant queries but may be less prominent when it does.
The reverse can also happen. Lower Query Success with stronger Average Position means the business performs well when it appears but does not surface across as many relevant queries.
6. Compare Against Competitors
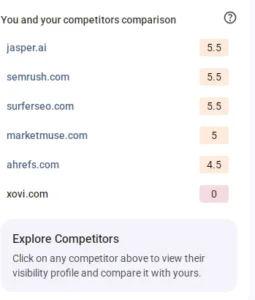
Riva uses offering-level visibility data for competitor comparison.
This helps agencies see which competitors surface alongside or instead of the client for relevant queries.
The comparison gives each offering more useful context. A visibility result means more when you can also see which businesses are appearing in the same buying situations.
Because different offerings can face different competitors, competitor context should also be viewed at the offering level rather than only at the overall brand level.
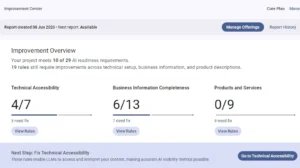
7. Use the Improvement Center
Visibility data tells you what is happening. The Improvement Center helps turn those findings into next actions.
It brings together:
- Technical accessibility
- Information completeness
- Offering-specific analysis
- Current status
- Recommended improvements
Teams can use these findings to see what should be improved and in what order.
The goal is not simply to increase a number. It is to identify specific issues that can be addressed, then monitor whether visibility changes after those improvements.
8. Track Changes Over Time
Reports can be regenerated every 15 days, giving agencies a consistent way to monitor changes in offering-level visibility and information quality.
Each offering can have its own audience, geographic focus, generated queries, and competitive context. For client reporting, compare each offering primarily against its own previous baseline rather than directly against another offering.
Riva is most useful when visibility is read at the offering level. AI Visibility shows how often an offering appears, Average Position shows how prominently it appears, and Query Success shows how consistently it appears across relevant generated queries.
Competitor context and the Improvement Center then help teams decide what to improve next.
The result is not one score for the whole business. It is a more detailed view of which offerings are visible, which are not, and where the biggest opportunities sit.
Frequently Asked Questions
Does Riva give one visibility score for the whole business?
No. Riva analyzes individual offerings separately, so different products or services can have different visibility results.
What does AI Visibility measure?
It shows how often an offering appears across the relevant AI queries generated around that offering.
What is Average Position?
It shows how prominently the business appears when it is mentioned in relevant AI answers.
What is Query Success?
It shows how many relevant generated queries result in the business appearing.
How often does Riva rerun reports?
Reports can be regenerated every two weeks, allowing teams to compare visibility over time.